8. Do Gun Control Laws Impact Gun Violence?
Gun control laws regularly inspire heated debate, although rarely useful insight.
All decent people agree that eliminating violent crimes should be prominent on every agenda. The trick is in deciding what’s the best way to get there. Some argue that limiting a population’s access to lethal weapons is the most direct way to prevent their misuse. Others, arguing with similar passion, insist that no law will stop criminals from finding the weapons they’re after, but their potential victims should be allowed the means to defend themselves (as they say: “When seconds count, the police are only minutes away”).
This article has no opinion on all that. But it is curious to know if there’s any statistical evidence supporting the effectiveness of gun control laws. In other words, do jurisdictions with strong laws consistently experience lower rates of gun violence? It would seem that any clear correlation between legislation and violence should help inform intelligent public policy.
As you might expect, there are many useful data resources we can draw on. In the interests of keeping things simple, we’ll stick to just a few easy-to-access data sets - and just one or two data points from each of those. Specifically, we’re going to explore the relationship between concealed carry laws and gun deaths through homicide. Personal injuries, financial crimes, and suicides committed with the use of a gun, while tragic, will not be our focus.
For practical reasons we’ll also need to distinguish between the United States and the rest of the world. The problem with the US is that, according to federal law, concealed carry is perfectly legal, but many individual states impose their own licensing requirements. Practically, this makes citizens' access to guns in the US highly dependent on their particular state. For that reason, there’s no value in comparing overall US statistics with the rest of the world. Instead, we’ll rank US states separately.
Quantifying International Gun Laws
Finding a way to define gun control legislation that’ll make sense across the widest range of countries isn’t going to be easy. Take a look through the information on the Wikipedia “Overview of gun laws by nation” page to get a sense of the problem. You’ll quickly see that finding a single legal standard that’s universally common isn’t possible. Some nations distinguish between weapon types or uses that others lump together. Often, it’s not a simple matter of “legal” or “illegal,” but licencing rules that are conditional on multiple factors.
The most useful proxy I can find is “concealed carry.” And I’ll use the table from that Wikipedia page. The table may look intimidating from the perspective of importing its data into Python, but there’s a great online website called wikitable2csv.ggor.de that will do all the world for us. We just need to paste the Wikipedia URL, click Convert, and the site does all the rest.
With that, we’re ready to begin. After importing the libraries we’ll need, we can read our new CSV file into a data frame.
import pandas as pd
import matplotlib as plt
import matplotlib.pyplot as plt

# https://en.wikipedia.org/wiki/Overview_of_gun_laws_by_nation
df = pd.read_csv('wikipedia_gun_law_table.csv')
The first thing I’ll do is update the name of the concealed carry column. Currently it’s Concealed carry[8] which will unnecessarily complicate things. Just plain old Carry will work fine:
df.rename(columns={'Concealed carry[8]':'Carry'}, inplace=True)
I’ll then get rid of the ten columns we won’t be using by reading just the country column Region and Carry into our data frame:
df = df[['Region', 'Carry']]
df.head()
	Region Carry
0	Afghanistan[9][law 1] Restricted
1	Albania[law 2] Self-defense permits
2	Algeria[10] No[N 2]
3	Andorra[law 3] Justification required
4	Angola[11] Restricted
This gives us a good view of some issues. Those brackets hold footnotes which, while important, are only going to get in our way. Besides brackets, the Carry column also has parentheses. These three commands will get rid of those markings and all the text they enclose:
df['Region'] = df['Region'].str.replace(r"\[.*\]","")
df['Carry'] = df['Carry'].str.replace(r"\[.*\]","")
df['Carry'] = df['Carry'].str.replace(r"\(.*\)","")
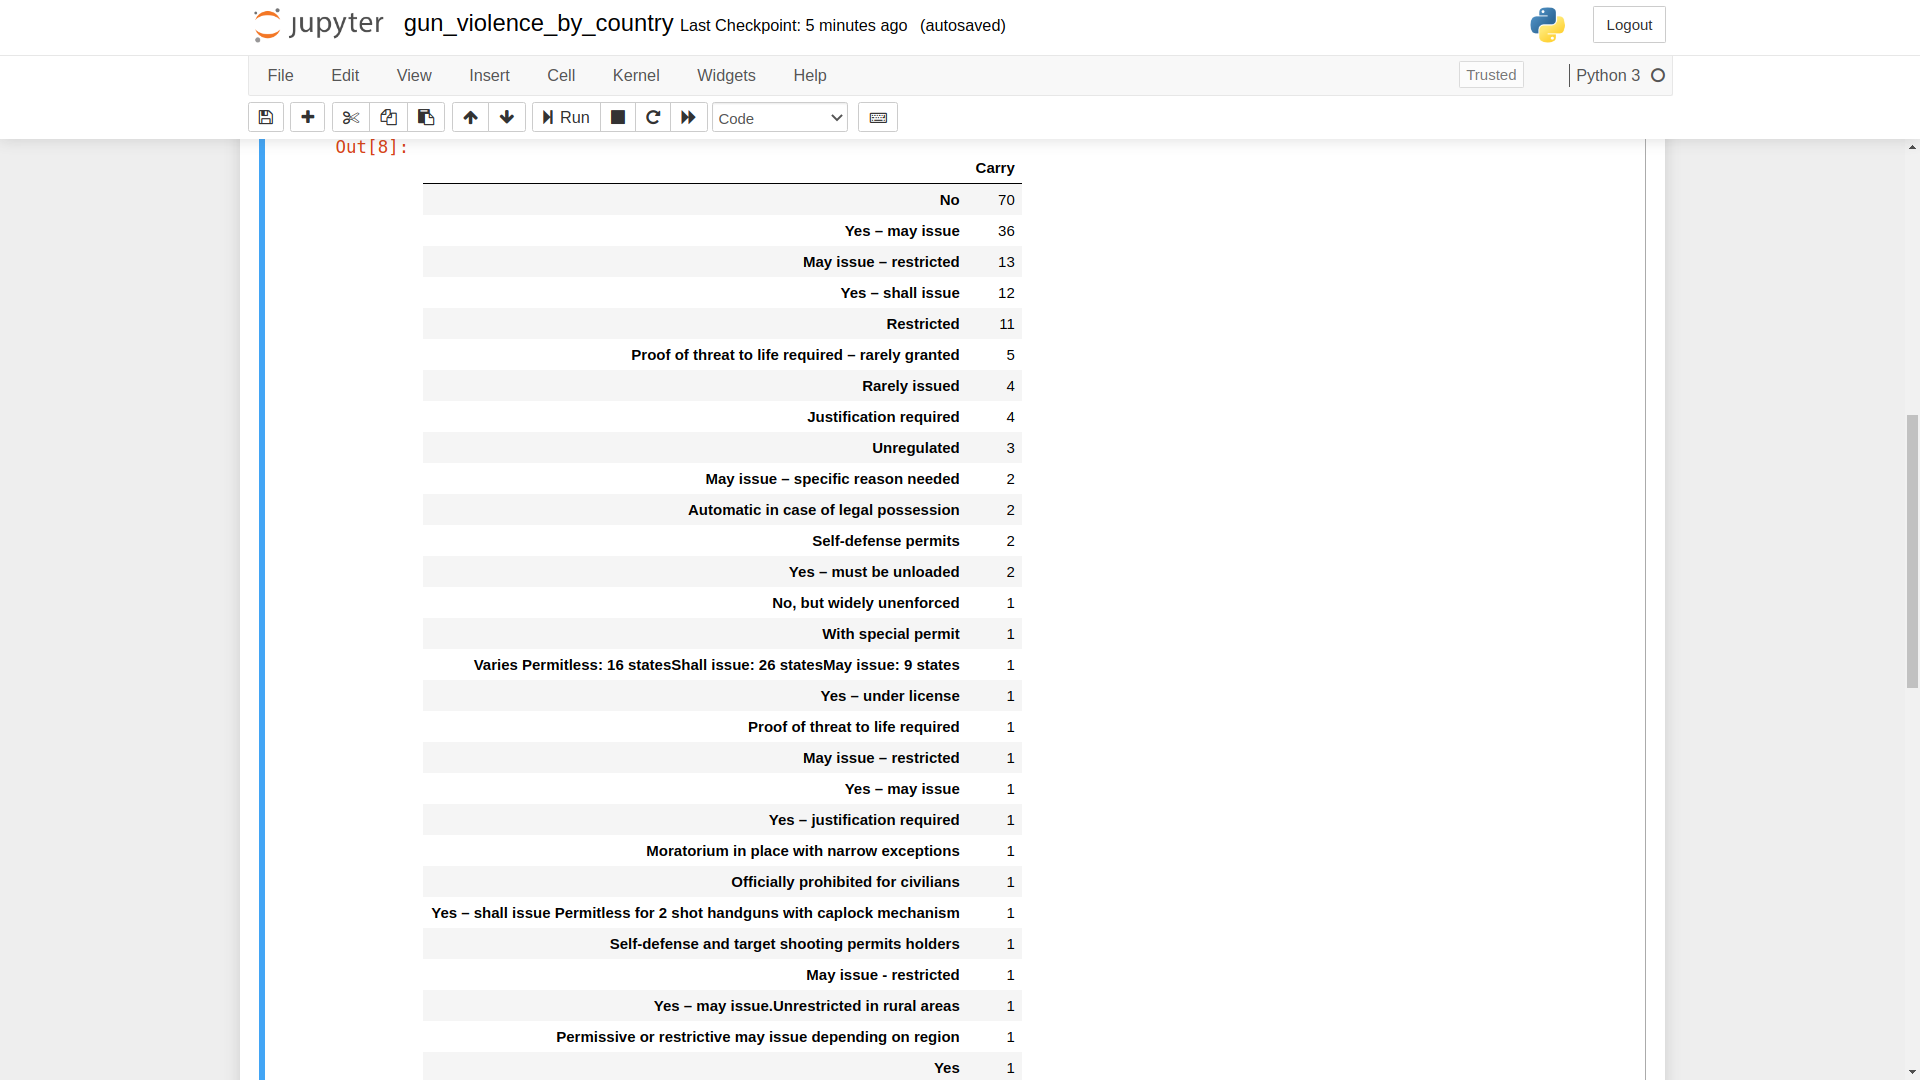
Now everything we want to do here depends on the values in the Carry column. The problem here, as the screenshot of the output of the value_counts() command shows us, is that there are nearly 30 unique values - many of them overlapping. It’ll be hard to track trends when there’s so little uniformity between legal standards.
df['Carry'].value_counts().to_frame()

So, wherever possible, I’ll try to combine multiple values where they’re intuitively similar. As it turns out, for instance, any row that contained the word Yes or No does indeed at least largely match the intent of a straight Yes (i.e., concealed carry is permitted) or No (i.e., it’s prohibited). This will bring the list of unique values down to about 18. Better.
import re
df['Carry'].replace(re.compile('.*Yes.*'), 'Yes', inplace=True)
df['Carry'].replace(re.compile('.*Rarely.*'), 'Rarely', inplace=True)
df['Carry'].replace(re.compile('.*rarely.*'), 'Rarely', inplace=True)
df['Carry'].replace(re.compile('.*No.*'), 'No', inplace=True)
df['Carry'].replace(re.compile('.*Restrict.*'), 'Restrict', inplace=True)
df['Carry'].replace(re.compile('.*restrict.*'), 'Restrict', inplace=True)
But not good enough yet. If you run value_counts() once again, you’ll see that there are quite a few values that apply to only one or two countries. Since those won’t be statistically significant, we can dump them. I’ll choose a unique string from each of those and use it to remove their rows:
df = df[~df.Carry.str.contains("Justification", na=False)]
df = df[~df.Carry.str.contains("legal", na=False)]
df = df[~df.Carry.str.contains("states", na=False)]
df = df[~df.Carry.str.contains("Moratorium", na=False)]
df = df[~df.Carry.str.contains("specific", na=False)]
Whatever’s left after all that won’t cause us any trouble.
Importing Gun Violence Data
We’re now ready for our gun violence data. For this, we’ll use numbers from the World Population Review site. Their “Gun Deaths by Country 2021” table contains four values for each country: Firearm-related death rate per 100,000 population per year, Homicide rate per year, Suicide rate per year, and Total death number per year. We’ll only be interested in the homicide rate column, but clicking the link to download CSV or JSON versions will get us the whole thing.
dfv = pd.read_csv('Gun-Related-Deaths_WPR.csv')
To make it possible to integrate our two data frames, I’ll rename the country column Region and, for clarity, homicide as Homicides. I’ll then save just the two columns we want into a new data frame.
dfv.rename(columns={'country':'Region'}, inplace=True)
dfv.rename(columns={'homicide':'Homicides'}, inplace=True)
dfv_data = dfv[['Region','Homicides']]
Plotting International Gun Violence Data
We should now be ready to merge our two data frames using pd.merge. on='Region' tells Pandas that the Region column in each source data frame should be the common reference.
merged_data = pd.merge(dfv_data, df, on='Region')
Here’s what our new data frame will look like:
merged_data.head()
	Region	Homicides	Carry
0	El Salvador	26.49	Yes
1	Jamaica	30.38	Yes
2	Panama		14.36	Yes
3	Uruguay	4.78	Yes
4	Montenegro	2.42	Yes
Everything is now ready for us to generate a scatter plot that’ll hopefully show us something useful. If you haven’t already, install the Plotly library on your machine using pip.
$ pip install plotly
Now we can import the libraries into our Jupyter notebook:
import plotly.graph_objs as go
import plotly.express as px
And this code will build us a scatter plot, complete with the information that’ll appear when we hover the mouse over a dot:
fig = px.scatter(merged_data, x="Homicides", y="Carry", log_x=True,
                 hover_data=["Homicides", "Carry", "Region"])
fig.show()

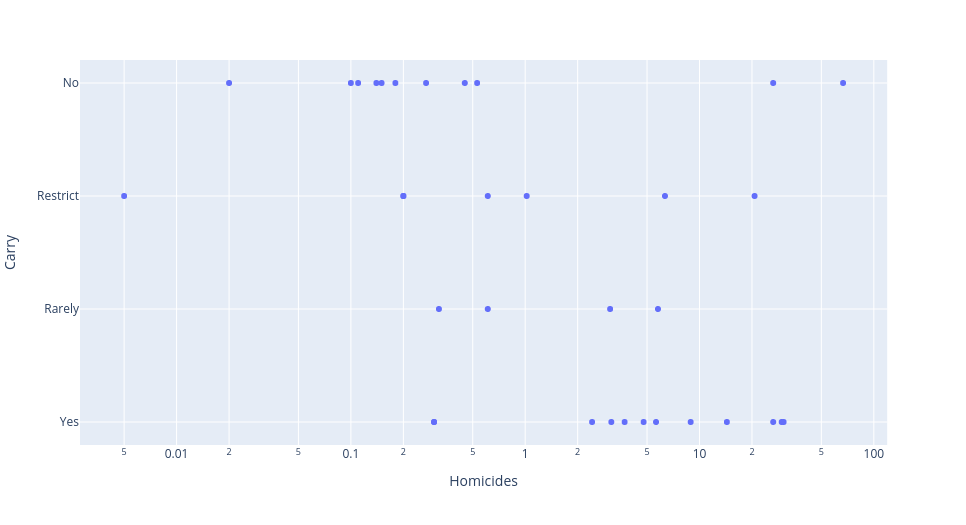
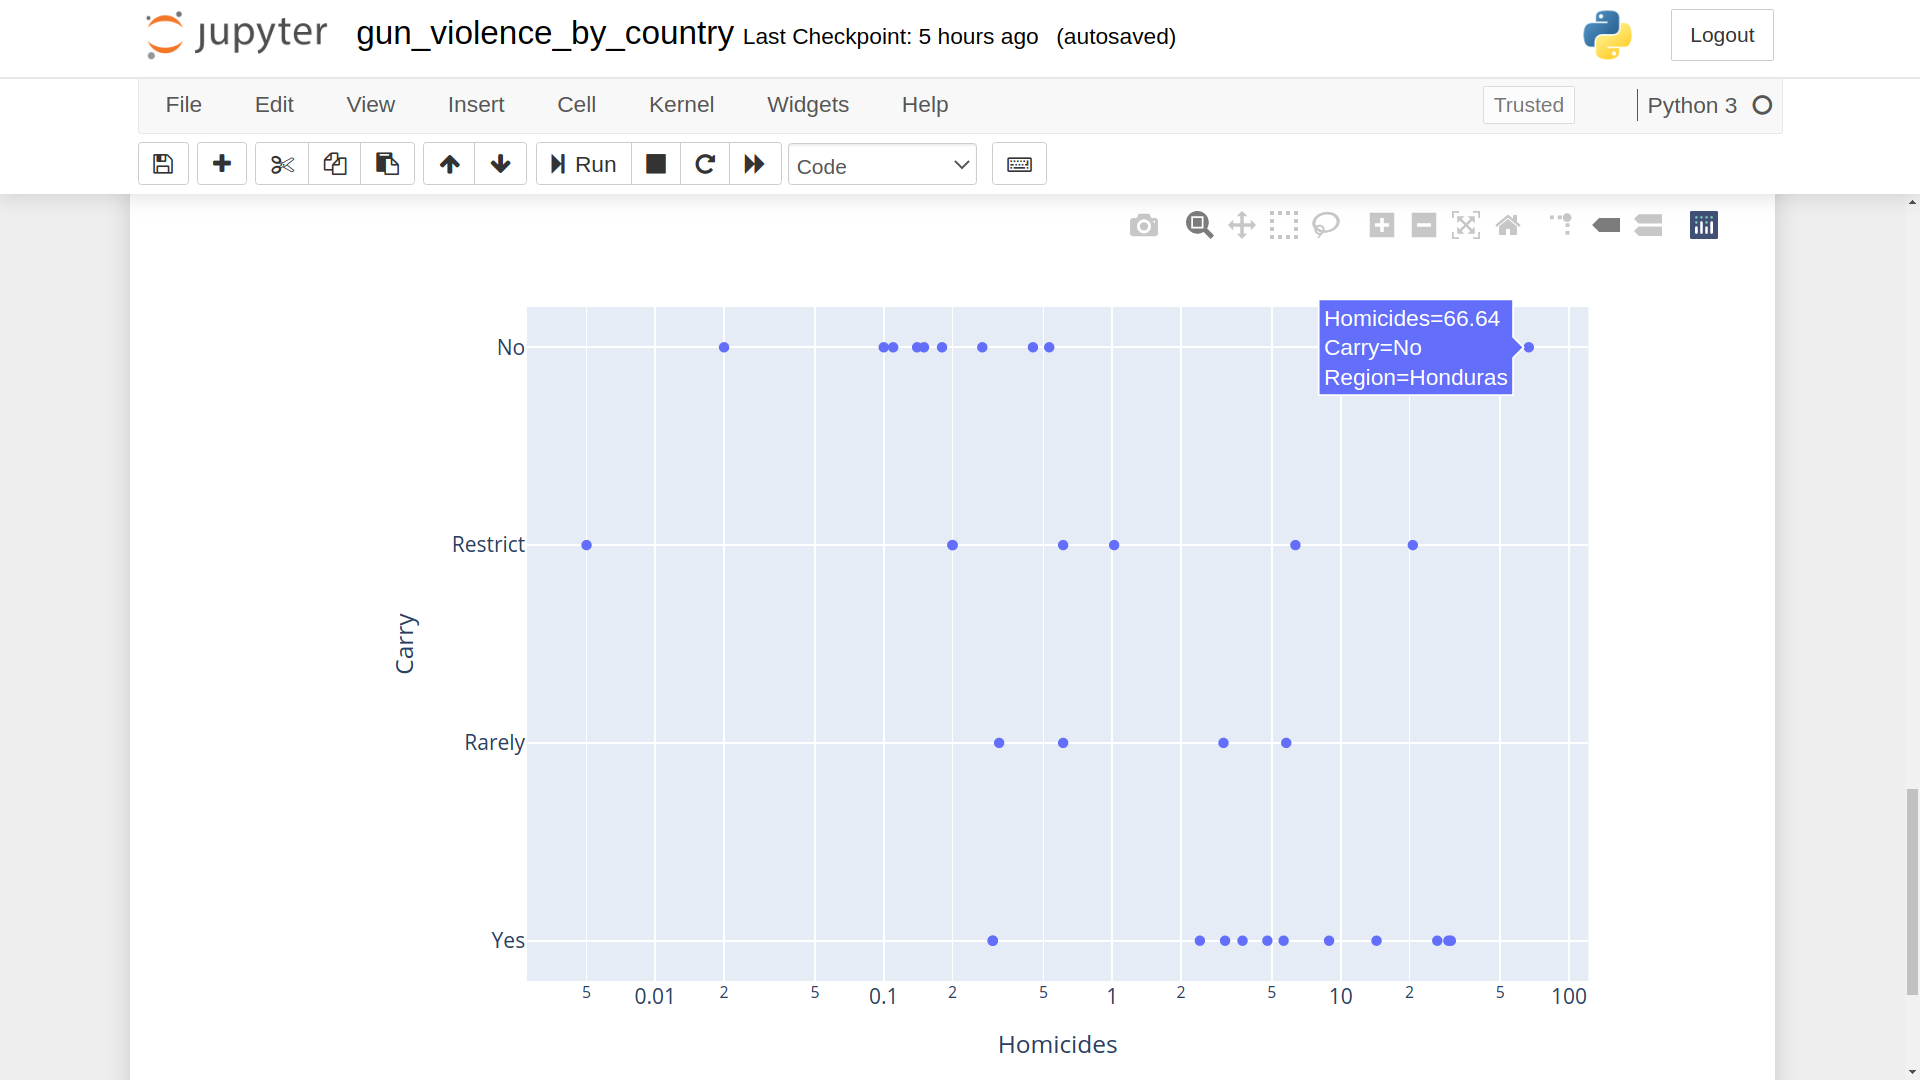
Note how Plotly spaced our homicide data across the X-axis. Because of the numbers we’re getting, the check points (0.01, 0.1, 1, etc.) don’t increase at a fixed rate, but by increments of ten. You can see that in action by hovering over the “No” point at the top right. Honduras, unfortunately, had more than 66 homicides for every 100,000 people in that year.

By contrast, Singapore had a microscopic murder rate of 0.005. To properly display a data set with such extremes, irregular spacing is necessary. Fortunately, Plotly does that for us automatically.
Ok. So what does it all tell us? First off, The Restrict and Rarely categories represent nations whose governments may permit conceal carry, but where it’s unusual. If we were to group those together with the No category, then a quick visual scan of the plot would suggest roughly equivalent outcomes between legal standards.
I have no idea if this has any significance but, except for Philippines, every single country whose gun murder rate is higher than 1/100,000 is in South or Central America or the Caribbean. What is significant is that those 17 countries are more or less evenly split between permissive and (largely) prohibitive gun carry legislation - and two of the top five rates are from “No” jurisdictions. The actual numbers are seven “No” and ten “Yes.”
On the other end of the spectrum, countries with very low murder rates skew heavily (14 to 1) towards restrictive laws.
On the other hand, suppose we were to group Restrict together with Yes. Perhaps “restrict” makes more sense as “yes, but with some restrictions.” In that case, the top 17 would be shifted to 13 (Yes) to 4 (No). But the bottom 15 would now be a bit more evenly balanced: 11 to 4.
Are more conclusive conclusions possible? Perhaps we need more data, or a better way to interpret and “translate” legal standards. But, either way, let’s turn our attention to data covering US states.
US Gun Laws and Gun Violence
I used a separate Jupyter notebook for this process. If you decide to stick both the world and US data together, be sure to update the data frame naming accordingly.
I’ll begin with data downloaded from the World Population Review Gun Laws by State 2021 page. I’ll load the CSV file in as always using Pandas:
df = pd.read_csv('US-carry-laws-by-state-WPR.csv')
For clarity, I’ll rename the permitReqToCarry column as PermitRequired and rewrite the data frame with only that and the State columns:
df.rename(columns={'permitReqToCarry':'PermitRequired'}, inplace=True)
df = df[['State','PermitRequired']]
As you can see from the Wyoming record in this head output, the table represents a negative value (i.e., no permit is required) as NaN. to make things easier for us, I’ll use fillna to replace those values with False.
df.head(10)
	State		PermitRequired
0	Washington	True
1	New York	True
2	New Jersey	True
3	Michigan	True
4	Maryland	True
5	Hawaii		True
6	Connecticut	True
7	California	True
8	Wyoming	NaN
9	Wisconsin	True

df.PermitRequired.fillna('False', inplace=True)
That’ll be all we’ll need for the legal side. I’ll use data from another Wikipedia page to provide us with information about gun violence. I manually removed the columns we’re not interested in before importing the CSV file.
dfv = pd.read_csv('gun_violence_by_US_State_Wikipedia.csv')
Running head against the data frame shows us we’ve got some cleaning up to do: there isn’t data for every state (as you can see from Alabama). So I’ll run str.contains to remove those rows altogether.
dfv.head()
	State		GunMurderRate
0	Alabama	— [a]
1	Alaska		5.3
2	Arizona	2.5
3	Arkansas	3.7
4	California	3.3

dfv = dfv[~dfv.GunMurderRate.str.contains("]", na=False)]
Just as we did with the world data earlier, I’ll create a merged_data data frame, this time referenced on the State column.
merged_data = pd.merge(dfv, df, on='State')
Once again - making sure Plotly is properly imported - I’ll plot my data:
import plotly.graph_objs as go
import plotly.express as px

fig = px.scatter(merged_data, x="GunMurderRate", y="PermitRequired",
                 log_x=True,
                 hover_data=["GunMurderRate", "PermitRequired", "State"])
fig.show()
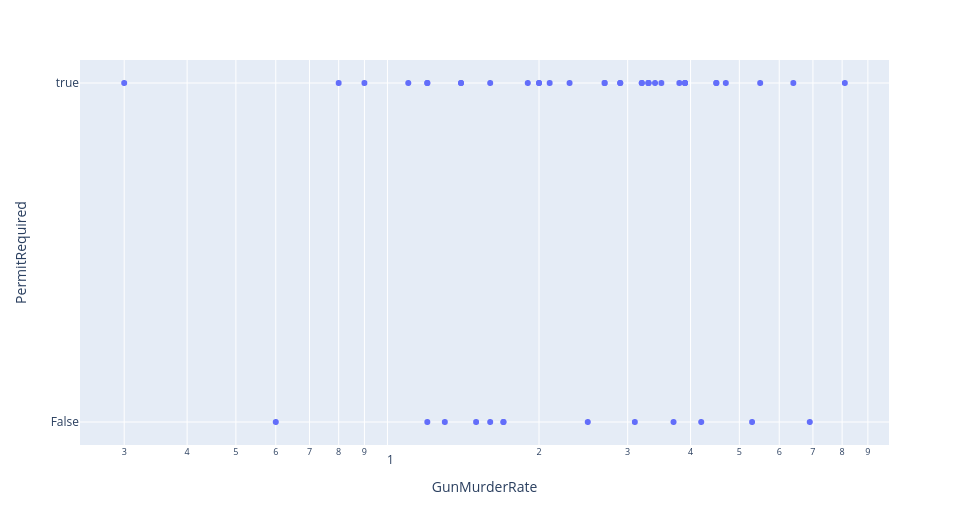
And here’s what that gives us:

Not very pretty, but it does give us a quick view of the action. The most noticeable feature is that there are far more states that require permits (“true”) than that don’t (“false”). Having said that, the “permit” states seem, on the whole, to be more clustered towards the dangerous end of the plot, led by Louisiana at 8.1 murders per 100,000 people.
The good news is that no US state has a murder rate that would rank anywhere near the “top” 17 countries we saw earlier. The better news, at least for those who live in Hawaii, is that citizens of that state enjoy great weather and a gun murder rate of 0.3. Not quite Singapore territory, but not bad at all.
But I think it’s reasonable to conclude from the US data at least, that stronger gun laws do not seem to have a noticeable effect on reducing gun crimes.